About our participants
We had 340 participants who fit our criteria and answered our survey. These included 91 staff members, 81 students, 69 faculty, 41 postdocs, and 24 who selected “Other”.
We had a wide array of disciplines represented in our participant pool as well:
| Disciplines | Count |
|---|---|
| Agricultural & Horticultural | 1 |
| Agricultural Sciences | 2 |
| Agronomy & Crop Science | 1 |
| Ancient Studies | 2 |
| Applied Mathematics | 4 |
| Aquatic Biology-Limnology | 1 |
| Archeology | 4 |
| Artificial Intelligence & Robotics | 1 |
| Astronomy | 6 |
| Astrophysics | 7 |
| Bioinformatics | 21 |
| Biology-Biological Sciences | 8 |
| Biomathematics & Bioinformatics | 1 |
| Biomedical Sciences | 2 |
| Biophysics | 1 |
| Biophysics & Molecular Biology | 1 |
| Biostatistics | 2 |
| Botany-Plant Biology | 1 |
| Cellular & Molecular Biology | 1 |
| Chemical Physics | 1 |
| Clinical Psychology | 2 |
| Cognitive Psychology | 3 |
| Communication Disorders | 1 |
| Community Health & Preventive Medicine | 1 |
| Community Organization & Advocacy | 1 |
| Comparative Literature | 1 |
| Computer & Information Sciences | 16 |
| Computer Programming | 4 |
| Computer Science | 26 |
| Data Modeling-Warehousing & Database Administration | 1 |
| Data Processing | 2 |
| Design & Visual Communications | 1 |
| Earth atmospheric & ocean sciences | 2 |
| Ecology & Evolutionary Biology | 14 |
| Education | 1 |
| Electrical & Electronic Engineering | 1 |
| Elementary Particle Physics | 6 |
| Energy Management & Systems | 1 |
| Engineering | 2 |
| Engineering Physics | 1 |
| Environmental Biology | 1 |
| Environmental Science | 3 |
| Epidemiology | 2 |
| Evolutionary Biology | 1 |
| Fishing & Fisheries Sciences | 3 |
| Genetics | 3 |
| Geography | 1 |
| Government & Politics | 1 |
| History | 8 |
| Humanities-Humanistic Studies | 2 |
| Hydrology & Water Resources | 1 |
| Industrial & Organizational Psychology | 1 |
| Information Science | 14 |
| Jewish-Judaic Studies | 1 |
| Kinesiology & Exercise Science | 1 |
| Library Science | 40 |
| Linguistics | 2 |
| Literature | 1 |
| Management Information Systems | 2 |
| Mathematics | 1 |
| Mathematics & Computer Science | 2 |
| Mechanical Engineering | 3 |
| Medical Informatics | 1 |
| Medicinal & Pharmaceutical Chemistry | 1 |
| Multi-Interdisciplinary Studies | 1 |
| Musicology & Ethnomusicology | 2 |
| Natural Products Chemistry & Pharmacognosy | 1 |
| Neuropharmacology | 1 |
| Neuroscience | 10 |
| Numeracy & Computational Skills | 1 |
| Oceanography Chemical & Physical | 1 |
| Other | 8 |
| Pharmacy | 1 |
| Physics | 13 |
| Psychology | 1 |
| Public Health | 1 |
| Public Policy Analysis | 1 |
| Public-Applied History & Archival Administration | 1 |
| Sociology | 3 |
| Soil Science & Agronomy | 1 |
| Solid State & Low-Temperature Physics | 1 |
| Statistics | 6 |
| Systematic Biology | 1 |
Status & Discipline
When did they start using VCS?
year_started_vcs <- dplyr::filter(output[0:2], first_vcs != "")
year_started_vcs <- year_started_vcs %>%
  mutate(year_vcs = replace(year_vcs, year_vcs == "1994 or earlier", "<= 1994"))

year_plot <- ggplot(year_started_vcs, aes(x=year_vcs, group=first_vcs, color=first_vcs)) +
  theme_bw() +
  geom_line(stat = "count") + theme(axis.text.x = element_text(vjust=0.90))  +
  theme(axis.text.x = element_text(vjust=0.5, angle=60)) +
  labs(title="", x="Year began using VCS", y="Count of Participants") +
  theme(legend.justification = "top", text=element_text(family="serif", face="bold")) +
  scale_color_discrete(name = "VCS") +
  theme(legend.key.size = unit(0.3, 'cm'),
        legend.key.height = unit(0.3, 'cm'),
        legend.key.width = unit(0.3, 'cm'),
        legend.title = element_text(size=10),
        legend.text = element_text(size=10)) +
  annotate("linerange", x = 11, ymin = 0, ymax = 19) +
  annotate("text", x = 11, y = 20, label="Git released", family="serif")

year_plot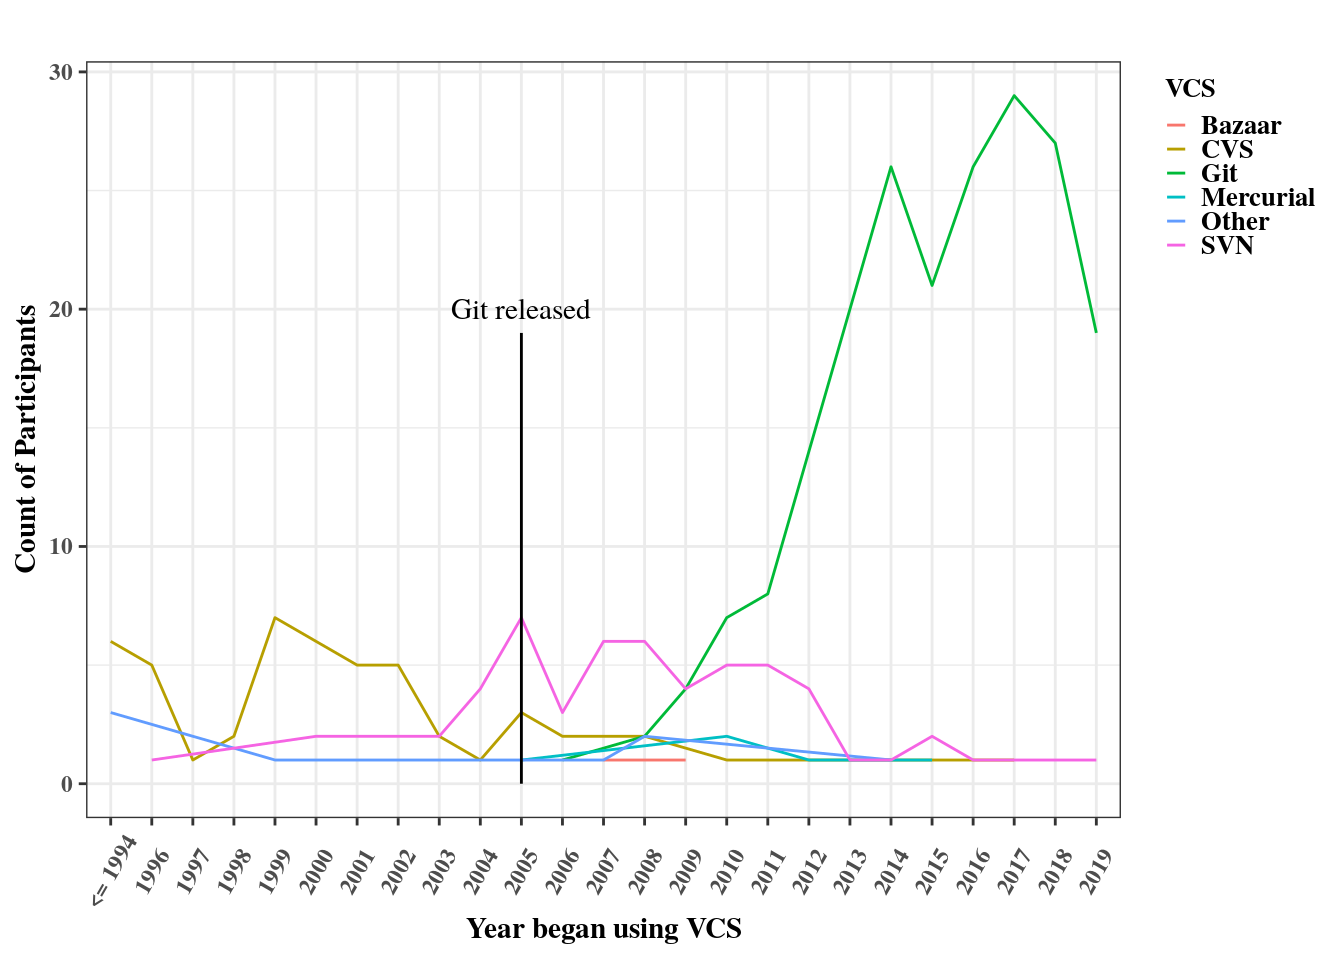
## Saving 7 x 5 in image